How Can Teachers Use Data Analytics To Improve Instruction? Part 2
Our previous blog post delved into the comprehensive understanding of data analytics, emphasizing its crucial role in optimizing learning outcomes. We explored how harnessing data analytics can contribute to maximizing student learning achievements. In this blog post, our focus shifts to Teaching Analytics—a concept we will explore in detail. We’ll examine its significance in classroom management, its role in enhancing learning outcomes, and how it is an informative tool for effective instructional strategies.

Teaching Analytics (TA)
Teaching Analytics (TA) constitutes an emerging theoretical framework amalgamating pedagogical proficiency, visual analytics, and design-based research. This innovative approach aims to augment the teacher’s capacity for diagnostic and analytic pedagogy, thereby enhancing the overall quality of instructional delivery. Despite its recent inception, TA has garnered increasing significance, owing to its potential to provide substantial advantages to educators.
A particular focus on the professional practices of teachers characterizes scholarly investigations into Teaching Analytics.
In my early years as a teacher, I struggled to find a way to meet the needs of all my students. Walking into my classroom during my first year as a second-grade teacher at a local suburban school, I was very naive to the wide range of needs that my students would have. As I started teaching, figuring out their needs was the most challenging. I tried a variety of strategies, but the method that stuck the most was meeting with students frequently on an individual basis. Meeting with them one-on-one allowed me to determine what each student needed to improve their reading or writing. I could then plan how to help them, usually meeting with them individually to ensure this growth happened.

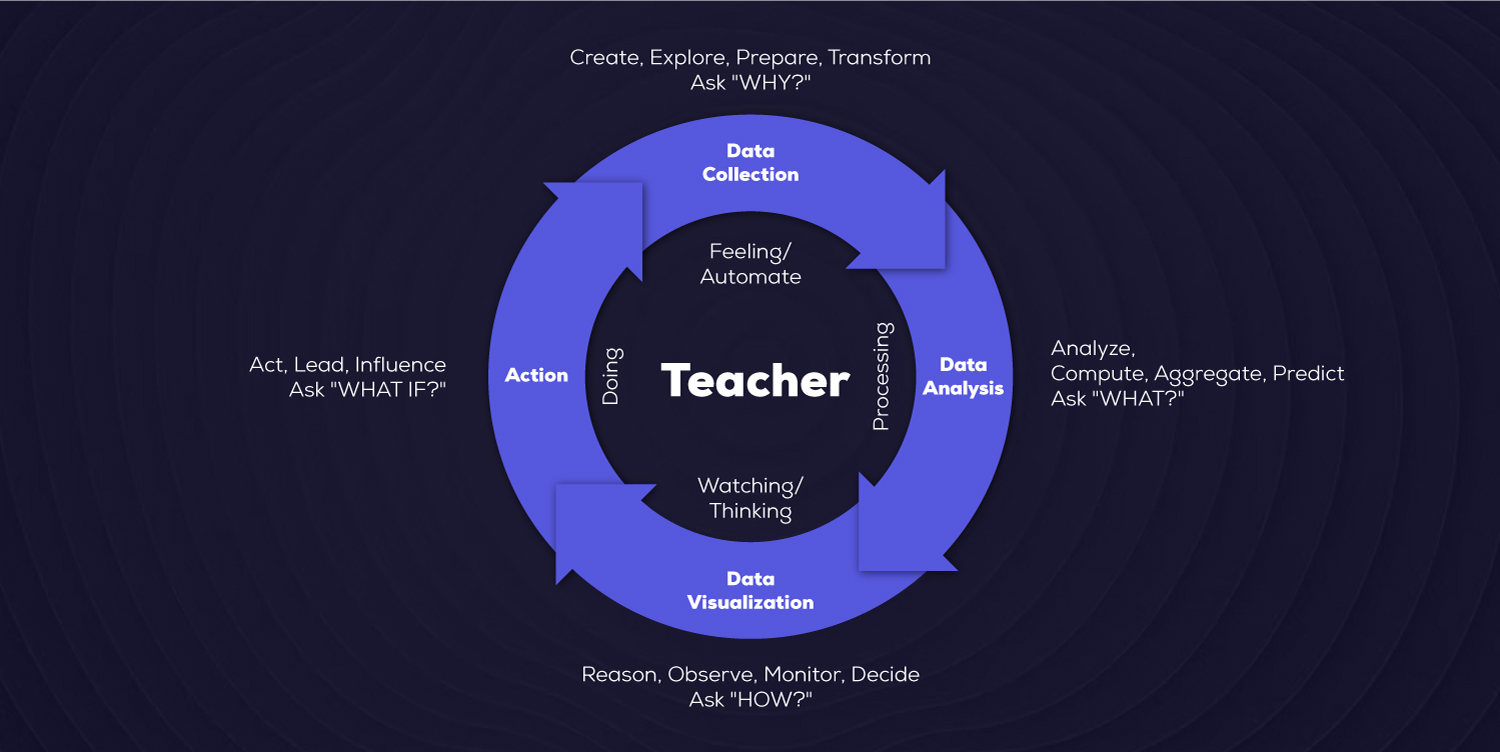
Scholars and practitioners in education have dedicated considerable attention to the Teaching Analytics (TA) process. They have employed diverse methods for data collection and visualization, including but not limited to classroom observation, solicitation of student feedback, utilization of audio and video recordings, and fostering teacher self-reflection. In this context, the TA is a facilitator, empowering educators to engage in analytical processes through visual representations, enriching and optimizing the teaching experience.
The quintessence of Teaching Analytics (TA) lies in guiding educational researchers to devise strategies that bolster teachers’ data literacy skills and knowledge. Notably, a data-driven approach to learning design necessitates a bottom-up methodology, positioning teachers as principal stakeholders in data literacy projects rather than mere end-users.
The overarching objectives encompass extending the understanding of TA, contextualizing its conceptual framework, and examining diverse data sources, machine learning algorithms and visualizations that guide teachers to enhance teaching practices and, consequently, elevate learning outcomes.
The burgeoning interest in acquiring evidence from educational contexts for purposes such as awareness, reflection, and decision-making is evident. Notably, extant research predominantly focuses on collecting and analyzing data concerning Teaching Analytics (TA) with an emphasis on student-centric parameters, encompassing various discussion and learning activities, as well as sensor data such as eye-tracking, position, and physical actions. This orientation, however, overlooks the equally vital dimension of monitoring teacher activities. A critical imperative lies in affording educators access to analytical insights into their instructional methodologies and elucidating how teachers can efficaciously leverage such data for pedagogical enhancement.
Student feedback on teaching is an additional method for collecting data within the classroom. The analytical examination of student feedback on teaching can bolster teacher reflection on instructional practices, thereby augmenting the value of Teaching Analytics (TA). This form of feedback, commonly referred to as Student Evaluations of Teaching (SET) or student ratings, represents a distinctive category of textual data. SET encapsulates quantitative and qualitative information, amalgamating students’ perspectives on specific facets of teaching performance. Consequently, the nuanced nature of SET contributes to a comprehensive understanding of the educational experience, facilitating a more informed and reflective approach to pedagogical refinement through the lens of teaching analytics.
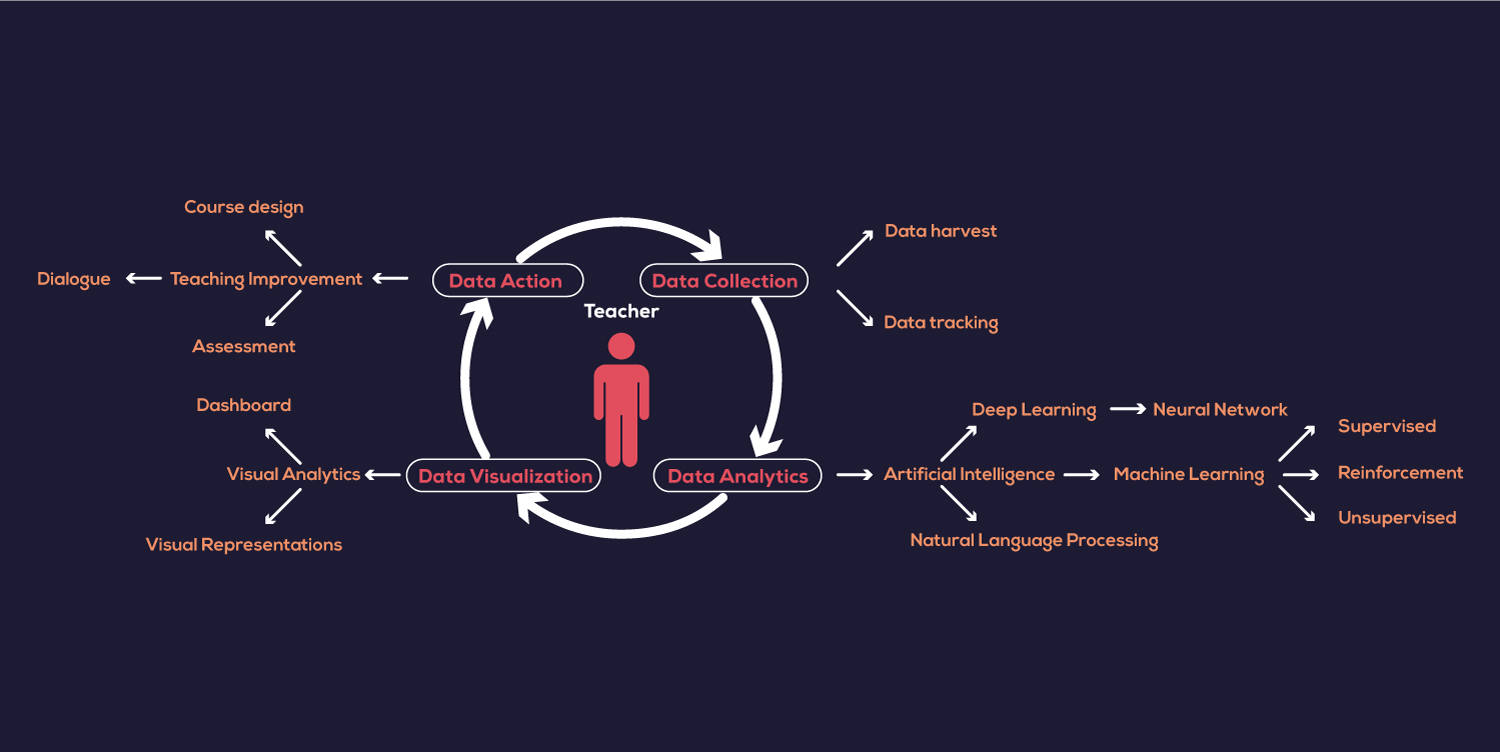
Human-mediated data collection mechanisms, including student feedback, self and peer observations, and teacher diaries, are viable supplements to enrich the landscape of Teaching Analytics (TA). Visual representations, exemplified by dashboards, emerge as instrumental tools for presenting teaching data, facilitating teachers in reflective processes and informed decision-making to enhance the quality of pedagogy. TA can be construed as a reconceptualization of Learning Analytics (LA) tailored to empower educators in refining teaching performance and optimizing learning outcomes, thereby occupying a pivotal position in the evolving domain of data-rich, technology-enhanced learning and teaching environments.
While acknowledging the indispensability of Learning Analytics (LA) in educational technology and the learning sciences, it is imperative to recognize its inherent limitations. LA, primarily reliant on automatically extracted data from educational platforms, predominantly offers an overview of student activities and participation, neglecting the nuanced role of teachers in these activities. Developing these skills necessitates a nuanced understanding of complex data structures and analytics, rendering TA indispensable in ameliorating teachers’ efficacy concerning educational data.
The evolving technological landscape has expanded the purview of analytics to diverse educational settings, necessitating efficient data collection and analysis tools. In this context, Teaching Analytics (TA) emerges as a crucial avenue for educators to engage with data, assess the efficacy of instructional strategies, and inform decision-making for quality enhancement. The implications of TA extend beyond mere analysis; it facilitates teacher reflection, thereby offering valuable insights into the effective interaction with teaching data.
Data sources within Teaching Analytics (TA) play a pivotal role in facilitating teacher reflection on the efficacy of their Learning Design (LD). Automated data collection methods, such as using wearable sensors worn by teachers during instructional activities, commonly referred to as in-class analytics, offer a dynamic means of capturing valuable insights. Increasingly, educational institutions are adopting video recordings of face-to-face classes, and some even extend their data collection efforts to include physiological data. As previously highlighted, these datasets surpass traditional pedagogical resources by providing tangible and illustrative evidence, thereby furnishing systematic feedback for teachers.
In-class analytics, encompassing data capture during conventional face-to-face teacher-centered instruction or teacher-student interactions, involves a comprehensive analysis to pinpoint potential areas for improvement. The diverse data types gathered in this setting include audio, video, body movement, brain activity, and cortex activity. Notably, this multilayered dataset enables teachers to conduct diagnostic analyses on recorded class videos, revealing intrinsic aspects of their instructional delivery. Such diagnostic analyses prove instrumental in enhancing teachers’ understanding of their teaching methodologies and uncovering avenues for further refinement.

Furthermore, Student Evaluations of Teaching (SET) represent an additional data source concerning teachers, collected through institutional application platforms. These evaluations can be visualized to provide actionable insights to improve teaching performance. The amalgamation of diverse data sources in TA, including in-class analytics and SET, establishes a comprehensive framework for teacher reflection, offering valuable opportunities for informed pedagogical enhancements and ongoing professional development.
Applying analytics within Learning Design (LD) involves systematically visualizing teaching plans to facilitate teacher reflection on various aspects. It includes visualizing the lesson plan’s coherence, assessing its alignment with educational objectives, and validating the method to identify potential inconsistencies in the teaching design. For instance, teachers can employ visualizations to determine the number and types of assessment activities within the lesson plan, gauging their relevance and currency. Similarly, educators may analyze the allocated time for each lesson activity, ensuring appropriateness and identifying any inconsistencies or imbalances in the temporal distribution across the overall lesson plan and individual activities.
Through these visualizations, teachers gain insights into the evolving dynamics of their instructional strategies. This analytical approach enables educators to make informed decisions about the relevance of assessment activities, the appropriateness of educational resources, and the effective time allocation within the lesson plan. Ultimately, integrating analytics into learning design supports teacher reflection and enhances instructional strategies’ overall quality and alignment with educational objectives.
The incorporation of Learning Design (LD) stands poised to significantly contribute to the organization and alignment of instructional intentions with the digital trace patterns left by learners, thereby advancing the comprehension and interpretation of Learning Analytics (LA). When LA is specifically tailored to harmonize with the design intent, teachers may perceive it as a valuable asset in refining subsequent LD interactions. In this context, LA emerges as an informative tool that aids tutors or designers in pedagogical decision-making. Consequently, teachers may leverage LA for real-time pedagogical decisions, such as dynamically grouping students based on their performance, thereby enhancing the responsiveness and adaptability of the learning environment.
Analysis Stage
The analysis stage in integrating analytics in education involves collaborative efforts among professionals such as data scientists, programmers, engineers, and researchers working with educators. In this stage, various techniques, including data mining, statistical methods, complex algorithms, and artificial intelligence (AI) techniques such as Natural Language Processing (NLP), Machine Learning (ML), and deep learning, are applied to ensure the quality of data and transform it into a meaningful analytical process.
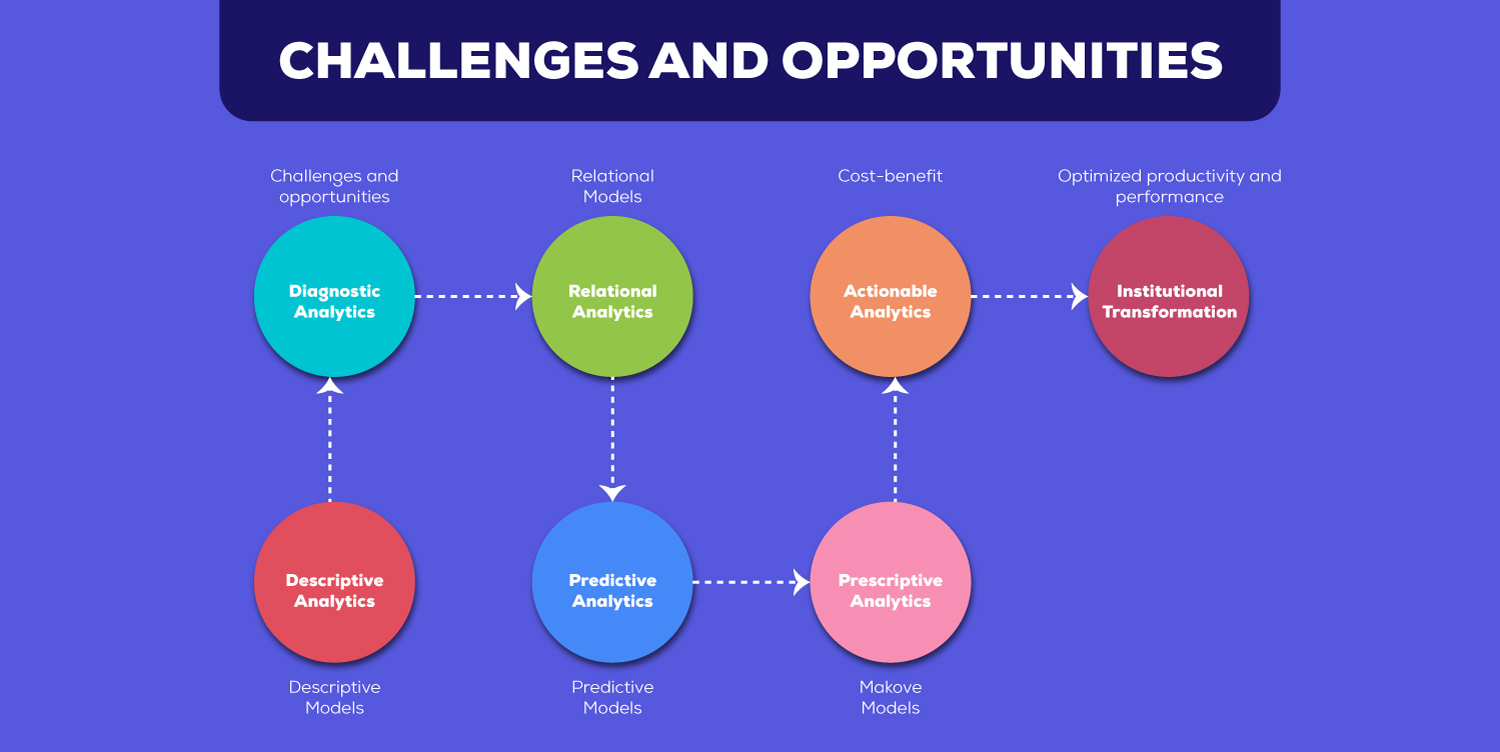
Analytics in education manifests in diverse forms, encompassing descriptive, diagnostic, predictive, and prescriptive analytics. These different forms provide high-level overviews and detailed insights into individual learners, teachers, faculty and their various activities, engagements, and behaviours. Unveiling the value of data analytics empowers educators and researchers to identify challenges, transforming them into opportunities to support teacher reflection and enhance teacher data literacy experiences. For instance, teachers can leverage NLP to extract topics from discussion posts, analyze contributions within collaborative projects, and discern sentiments.
Moreover, combining Machine Learning techniques with Teaching Analytics (TA) can potentially augment teaching outcomes. For example, chatbots can serve as teacher’s assistants in large classes, providing valuable support. However, a critical consideration in analytics is the potential for data de-identification, significantly as datasets increase in size and scope, leading to the generation of big data. To address privacy concerns, a specific university has implemented a two-stage method of data de-identification along with robust data governance measures to restrict data access.

Conclusion
However, the data collection, visualization, and analysis landscape is challenging, encompassing bias, ethical and privacy concerns, and the imperative of effective engagement with analytics. A concerted effort is required to design information flows that facilitate evidence-based decision-making to address these challenges. Furthermore, to ensure the instructional design and learning support are evidence-based, the administration should empower teachers with the requisite analytics and data literacy knowledge to interpret findings accurately and make informed pedagogical decisions.
